

SwiftUI 框架於 WWDC 2019 推出,讓 iOS 社群十分興奮。這個以 Swift 所寫的宣告式 (declarative) API 容易使用,讓開發者可以快速建構 UI 原型 (prototype)。
儘管我們可以利用 Shapes 協定從零開始建構直條圖 (Bar Chart),但卻無法以同樣方式建構折線圖。幸好,我們有 Paths 結構來達成目的。
SwiftUI 的 Path 類似與 Core Graphics 框架的 CGPaths,我們可以利用 Paths 來組合線條和曲線,以建構漂亮的 Logo 和形狀。
Path 遵循宣告式方法來編寫 UI,由一組指令組成。在下文中,我們將討論這句話是甚麼意思。
目標
- 探索 SwiftUI 的 Path API,並創建簡單的形狀。
- 利用 Combine 和 URLSession 來獲取歷史庫存數據。我們將使用 Alpha Vantage 的 API 檢索股票信息。
- 在 SwiftUI 創建折線圖,來顯示一段時間內的股票價格。
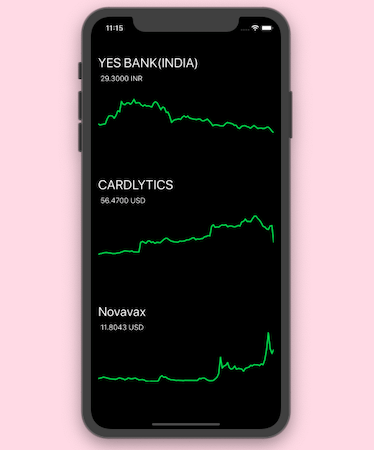
讀完本篇文章後,你應該可以建構一個像這樣的 iOS App:
建構一個簡單的 SwiftUI Path
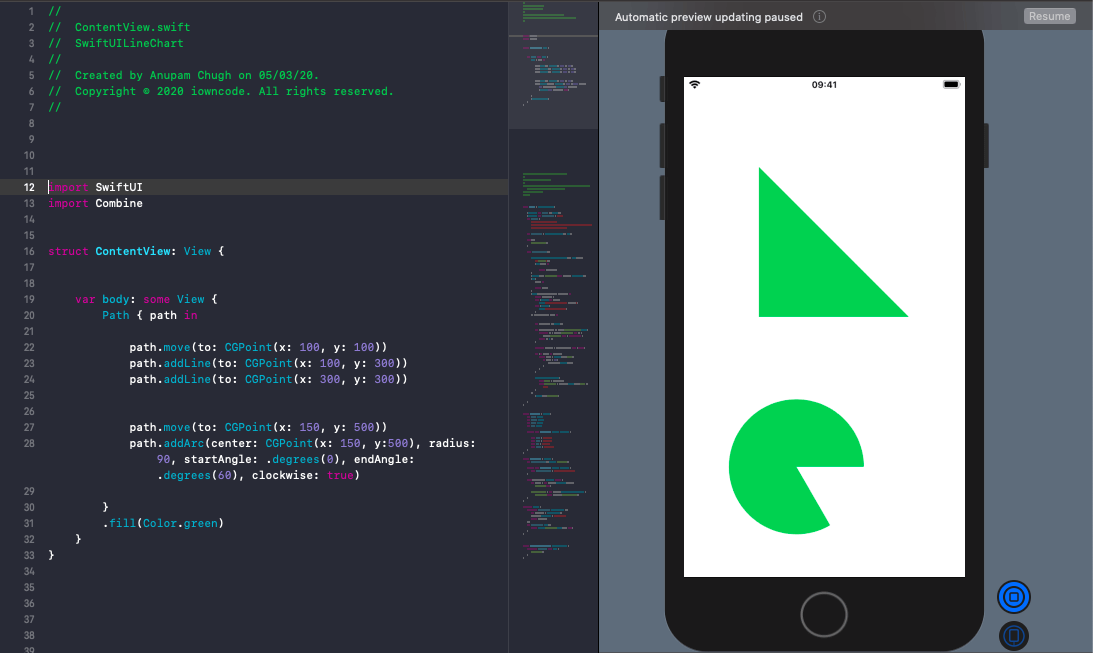
以下是利用 SwiftUI Path 創建一個直角三角型的例子:
var body: some View {
Path { path in
path.move(to: CGPoint(x: 100, y: 100))
path.addLine(to: CGPoint(x: 100, y: 300))
path.addLine(to: CGPoint(x: 300, y: 300))
}.fill(Color.green)
}
Path API 由許多函式組成。move 負責設置 Path 的起點,而 addLine 負責繪製到指定目標點的直線。
而 addArc、addCurve、addQuadCurve、addRect、和 addEllipse 這些方法,讓我們可以利用 Path 創建圓弧 (circular arc) 或貝茲曲線 (Bezier curve)。
我們可以使用 addPath 來附加兩個或以上的 Path。
下圖顯示了一個三角形和一個圓餅圖:
現在,我們已經瞭解了如何在 SwiftUI 中創建 Path,讓我們來看看 SwiftUI 中的折線圖吧!
SwiftUI 折線圖
以下是用來解碼 API JSON 回應的模型:
struct StockPrice : Codable{
    let open: String
    let close: String
    let high: String
    let low: String

    private enum CodingKeys: String, CodingKey {

        case open = "1. open"
        case high = "2. high"
        case low = "3. low"
        case close = "4. close"
    }
}

struct StocksDaily : Codable {
    let timeSeriesDaily: [String: StockPrice]?

    private enum CodingKeys: String, CodingKey {
        case timeSeriesDaily = "Time Series (Daily)"
    }

    init(from decoder: Decoder) throws {
        let values = try decoder.container(keyedBy: CodingKeys.self)

        timeSeriesDaily = try (values.decodeIfPresent([String : StockPrice].self, forKey: .timeSeriesDaily))
    }
}
讓我們創建一個 ObservableObject 類別。我們將使用 URLSession 的 Combine Publisher 執行 API 請求,並使用 Combine 運算符 (operator) 轉換結果。
class Stocks : ObservableObject{

    @Published var prices = [Double]()
    @Published var currentPrice = "...."
    var urlBase = "https://www.alphavantage.co/query?function=TIME_SERIES_DAILY&symbol=NSE:YESBANK&apikey=demo&datatype=json"

    var cancellable : Set<AnyCancellable> = Set()

    init() {
        fetchStockPrice()
    }

    func fetchStockPrice(){

        URLSession.shared.dataTaskPublisher(for: URL(string: "\(urlBase)")!)
            .map{output in

                return output.data
        }
        .decode(type: StocksDaily.self, decoder: JSONDecoder())
        .sink(receiveCompletion: {_ in
            print("completed")
        }, receiveValue: { value in

            var stockPrices = [Double]()

            let orderedDates =  value.timeSeriesDaily?.sorted{
                guard let d1 = $0.key.stringDate, let d2 = $1.key.stringDate else { return false }
                return d1 < d2
            }

            guard let stockData = orderedDates else {return}

            for (_, stock) in stockData{
                if let stock = Double(stock.close){
                    if stock > 0.0{
                        stockPrices.append(stock)
                    }
                }
            }

            DispatchQueue.main.async{
                self.prices = stockPrices
                self.currentPrice = stockData.last?.value.close ?? "..."
            }
        })
            .store(in: &cancellable)

    }
}

extension String {
    static let shortDate: DateFormatter = {
        let formatter = DateFormatter()
        formatter.dateFormat = "yyyy-MM-dd"
        return formatter
    }()
    var stringDate: Date? {
        return String.shortDate.date(from: self)
    }
}
API 結果由 nested 的 JSON 和作為日期的鍵組成。因為它們在字典中沒有排序,所以我們需要進行排序。為此,我們宣告了一個 extension,將字串轉換為日期,並在 sort 函式中進行比較。
現在我們已經在 Published 屬性中獲取了價格和股票數據,下一步我們需要將它們傳遞給 LineView ── 我們接下來會看到的客製化 SwiftUI 視圖。
struct LineView: View {
    var data: [(Double)]
    var title: String?
    var price: String?

    public init(data: [Double],
                title: String? = nil,
                price: String? = nil) {

        self.data = data
        self.title = title
        self.price = price
    }

    public var body: some View {
        GeometryReader{ geometry in
            VStack(alignment: .leading, spacing: 8) {
                Group{
                    if (self.title != nil){
                        Text(self.title!)
                            .font(.title)
                    }
                    if (self.price != nil){
                        Text(self.price!)
                            .font(.body)
                        .offset(x: 5, y: 0)
                    }
                }.offset(x: 0, y: 0)
                ZStack{
                    GeometryReader{ reader in
                        Line(data: self.data,
                             frame: .constant(CGRect(x: 0, y: 0, width: reader.frame(in: .local).width , height: reader.frame(in: .local).height)),
                             minDataValue: .constant(nil),
                             maxDataValue: .constant(nil)
                        )
                            .offset(x: 0, y: 0)
                    }
                    .frame(width: geometry.frame(in: .local).size.width, height: 200)
                    .offset(x: 0, y: -100)

                }
                .frame(width: geometry.frame(in: .local).size.width, height: 200)

            }
        }
    }
}
上面的視圖是由 SwiftUI ContentView 呼叫的,ContentView 就是我們傳遞名稱、價格、和價格歷史記錄陣列的地方。我們使用 GeometryReader 將框架的寬度和高度傳遞給 Line 結構,在這裡我們將使用 SwiftUI Path,將這些點連接起來:
struct Line: View {
    var data: [(Double)]
    @Binding var frame: CGRect

    let padding:CGFloat = 30

    var stepWidth: CGFloat {
        if data.count < 2 {
            return 0
        }
        return frame.size.width / CGFloat(data.count-1)
    }
    var stepHeight: CGFloat {
        var min: Double?
        var max: Double?
        let points = self.data
        if let minPoint = points.min(), let maxPoint = points.max(), minPoint != maxPoint {
            min = minPoint
            max = maxPoint
        }else {
            return 0
        }
        if let min = min, let max = max, min != max {
            if (min <= 0){
                return (frame.size.height-padding) / CGFloat(max - min)
            }else{
                return (frame.size.height-padding) / CGFloat(max + min)
            }
        }

        return 0
    }
    var path: Path {
        let points = self.data
        return Path.lineChart(points: points, step: CGPoint(x: stepWidth, y: stepHeight))
    }

    public var body: some View {

        ZStack {

            self.path
                .stroke(Color.green ,style: StrokeStyle(lineWidth: 3, lineJoin: .round))
                .rotationEffect(.degrees(180), anchor: .center)
                .rotation3DEffect(.degrees(180), axis: (x: 0, y: 1, z: 0))
                .drawingGroup()
        }
    }
}
stepWidth 和 stepHeight 可以將圖表限制在框架的指定寬度和高度內,然後我們將它們傳遞給 Path 結構的 extension 函式,以創建折線圖:
extension Path {
static func lineChart(points:[Double], step:CGPoint) -> Path {
var path = Path()
if (points.count < 2){
return path
}
guard let offset = points.min() else { return path }
let p1 = CGPoint(x: 0, y: CGFloat(points[0]-offset)*step.y)
path.move(to: p1)
for pointIndex in 1..<points.count {
let p2 = CGPoint(x: step.x * CGFloat(pointIndex), y: step.y*CGFloat(points[pointIndex]-offset))
path.addLine(to: p2)
}
return path
}
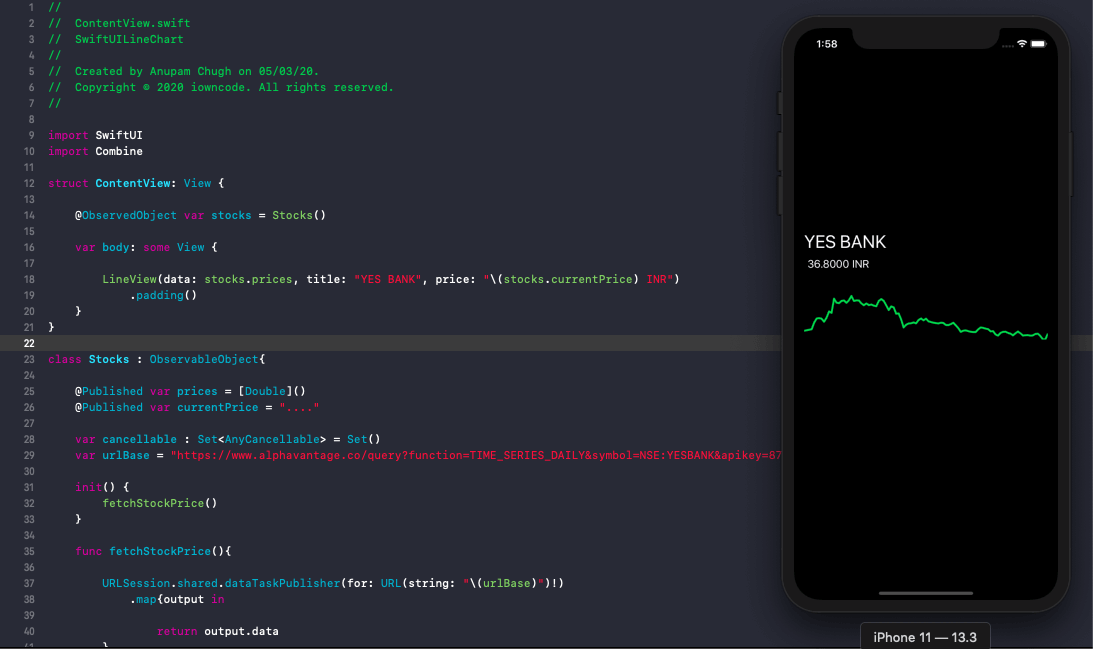
}最後,SwiftUI App 成功顯示股票價格圖了:
總結
在這篇文章中,我們再次將 SwiftUI 和 Combine 搭配使用,來取得股票價格,並以折線圖表達數據。要學好 SwiftUI Shape 的使用,就先要了解 SwiftUI Path,並嘗試實作 path 函式。
你可以利用以上的 SwiftUI 折線圖,來嘗試實作更多東西,例如用手勢 (gesture) 來突出某個點及其相應的值。如果你有興趣實作,可以看看這個程式庫。
你可以在 GitHub 程式庫 上取得 App 的完整程式碼。
本篇文章到此為止,謝謝你的閱讀。